
Bitcoin (BTC)
#1

Ethereum (ETH)
#2

Ripple (XRP)
#3

Binance Coin (BNB)
#4

Solana (SOL)
#5

Cardano (ADA)
#6

Tron (TRX)
#7

Lido Staked Ether (STETH)
#8

Wrapped Bitcoin (WBTC)
#9

LEO Token (LEO)
#10

Tokamak Network (TON)
#11

Toncoin (TON)
#12

Chainlink (LINK)
#13

Stellar (XLM)
#14

Avalanche (AVAX)
#15

Shiba Inu (SHIB)
#16

Sui (SUI)
#17

Hedera (HBAR)
#18

Litecoin (LTC)
#19

Polkadot (DOT)
#20

Mantra (OM)
#21

Bitcoin Cash (BCH)
#22

Bitget Token (BGB)
#23

Monero (XMR)
#24

PI Network (PI)
#25

Uniswap (UNI)
#26

Dai (DAI)
#27

NEAR Protocol (NEAR)
#28

Aptos (APT)
#29

Pepe (PEPE)
#30

OKB (OKB)
#31

Gate (GT)
#32

Cronos (CRO)
#33

Ondo (ONDO)
#34

Mantle (MNT)
#35

Internet Computer (ICP)
#36

Ethereum Classic (ETC)
#37

Aave (AAVE)
#38

Cosmos (ATOM)
#39

VeChain (VET)
#40

MAGA (TRUMP)
#41

Official Trump (TRUMP)
#42

Filecoin (FIL)
#43

Bittensor (TAO)
#44

Fasttoken (FTN)
#45

Kaspa (KAS)
#46
.png)
POL (ex-MATIC) (POL)
#47

Render (RENDER)
#48

Celestia (TIA)
#49

Ethena (ENA)
#50

Algorand (ALGO)
#51

Arbitrum (ARB)
#52

KuCoin (KCS)
#53

EOS (EOS)
#54

Maker (MKR)
#55

Optimism (OP)
#56

Artif. Sup. Alliance (FET)
#57

Jupiter (JUP)
#58

NEXO (NEXO)
#59

XDC Network (XDC)
#60

Quant (QNT)
#61

Worldcoin (WLD)
#62

DeXe (DEXE)
#63

Stacks (STX)
#64

Bonk (BONK)
#65

Immutable (IMX)
#66

Flare (FLR)
#67

Injective (INJ)
#68

Sei (SEI)
#69

The Graph (GRT)
#70

Tether Gold (XAUT)
#71

Theta Network (THETA)
#72

Lido DAO (LDO)
#73

PAX Gold (PAXG)
#74

Tezos (XTZ)
#75

GALA (GALA)
#76

Curve DAO (CRV)
#77

Kaia (KAIA)
#78

Zcash (ZEC)
#79

The Sandbox (SAND)
#80

BitTorrent (BTT)
#81

Bitcoin SV (BSV)
#82

IOTA (IOTA)
#83

Jito (JTO)
#84

Flow (FLOW)
#85

PancakeSwap (CAKE)
#86

Floki (FLOKI)
#87

Grass (GRASS)
#88

Ava AI (AVA)
#89

Raydium (RAY)
#90

Helium (HNT)
#91

Pendle (PENDLE)
#92

Beldex (BDX)
#93

JasmyCoin (JASMY)
#94

dYdX (DYDX)
#95

Pyth Network (PYTH)
#96

Decentraland (MANA)
#97

Telcoin (TEL)
#98

Kava (KAVA)
#99

APENFT (NFT)
#100

Axie Infinity (AXS)
#101

Core (CORE)
#102

MultiversX (EGLD)
#103

Fartcoin (FARTCOIN)
#104

Ronin (RON)
#105

Conflux (CFX)
#106

Compound (COMP)
#107

Starknet (STRK)
#108

Chiliz (CHZ)
#109

THORChain (RUNE)
#110

Wormhole (W)
#111

eCash (XEC)
#112

Dogwifhat (WIF)
#113

Arweave (AR)
#114

ApeCoin (APE)
#115

Frax (FRAX)
#116

Beam (BEAM)
#117

Virtuals Protocol (VIRTUAL)
#118

Trust Wallet (TWT)
#119

Polygon (MATIC)
#120

LayerZero (ZRO)
#121

Axelar (AXL)
#122

NEO (NEO)
#123

Just (JST)
#124

Amp (AMP)
#125

Cheems Token (CHEEMS)
#126

Gnosis (GNO)
#127

Brett (BRETT)
#128

Aerodrome Finance (AERO)
#129

Safe (SAFE)
#130

Mina Protocol (MINA)
#131

Akash Network (AKT)
#132

MX (MX)
#133

Dash (DASH)
#134

SafePal (SFP)
#135

Creditcoin (CTC)
#136

AIOZ Network (AIOZ)
#137

1inch (1INCH)
#138

Venom (VENOM)
#139

Kusama (KSM)
#140

Cat in a dogs world (MEW)
#141

Aethir (ATH)
#142

Golem (GLM)
#143

Blur (BLUR)
#144

Theta Fuel (TFUEL)
#145

ZKsync (ZK)
#146

Snek (SNEK)
#147

Wemix (WEMIX)
#148

Zilliqa (ZIL)
#149

Synthetix Network (SNX)
#150

SuperVerse (SUPER)
#151

Notcoin (NOT)
#152

Nervos Network (CKB)
#153

Echelon Prime (PRIME)
#154

DigiByte (DGB)
#155

Astar (ASTR)
#156

Basic Attention Token (BAT)
#157

Eigenlayer (EIGEN)
#158

SwissBorg (BORG)
#159

Qtum (QTUM)
#160

0x Protocol (ZRX)
#161

Arkham (ARKM)
#162

SingularityNET (AGIX)
#163

ZetaChain (ZETA)
#164

Baby Doge Coin (BABYDOGE)
#165

Decred (DCR)
#166

Aelf (ELF)
#167

VeThor (VTHO)
#168

Stargate Finance (STG)
#169

IoTeX (IOTX)
#170

Livepeer (LPT)
#171

Osmosis (OSMO)
#172

OriginTrail (TRAC)
#173

Moca Coin (MOCA)
#174

UxLink (UXLINK)
#175

Celo (CELO)
#176

Holo (HOT)
#177

Frax Share (FXS)
#178

CHEX Token (CHEX)
#179

Ankr Network (ANKR)
#180

Convex Finance (CVX)
#181

AI Companions (AIC)
#182

Sun Token (SUN)
#183

Oasis (ROSE)
#184

yearn.finance (YFI)
#185

Ravencoin (RVN)
#186

Chia (XCH)
#187

Siacoin (SC)
#188

Hamster Kombat (HMSTR)
#189

Popcat (POPCAT)
#190

Harmony (ONE)
#191

DeepBook (DEEP)
#192

Drift Protocol (DRIFT)
#193

ORDI (ORDI)
#194

Gomining Token (GOMINING)
#195

Gigachad (GIGA)
#196

Tribe (TRIBE)
#197

Polymesh (POLYX)
#198

Peanut the Squirrel (PNUT)
#199

Mog Coin (MOG)
#200

Threshold Network (T)
#201

Polyhedra Network (ZKJ)
#202

Constellation (DAG)
#203

Metaplex (MPLX)
#204

Bitkub Coin (KUB)
#205

NEM (XEM)
#206

Hivemapper (HONEY)
#207

Gas (GAS)
#208

Enjin Coin (ENJ)
#209

Horizen (ZEN)
#210

LCX (LCX)
#211

Mythos (MYTH)
#212

WOO (WOO)
#213

GMT (GMT)
#214

Galxe (GAL)
#215

Kadena (KDA)
#216

Ontology (ONT)
#217

Loopring (LRC)
#218

XYO Network (XYO)
#219

Skale (SKL)
#220

Turbo (TURBO)
#221

Casper Network (CSPR)
#222

Zeus Network (ZEUS)
#223

Orca (ORCA)
#224

Ether.fi (ETHFI)
#225

VVS Finance (VVS)
#226

Mask Network (MASK)
#227

COTI (COTI)
#228

GMX (GMX)
#229

Qubic (QUBIC)
#230

Prom (PROM)
#231

Euler (EUL)
#232

Solar (SXP)
#233

Big Time (BIGTIME)
#234

Waves (WAVES)
#235

Sushi Swap (SUSHI)
#236

Alchemy Pay (ACH)
#237

Band Protocol (BAND)
#238
.png)
SATS (Ordinals) (SATS)
#239

Gravity (G)
#240

Zignaly (ZIG)
#241

Syrup (SYRUP)
#242

API3 (API3)
#243

Bora (BORA)
#244

Hive (HIVE)
#245

CoW Protocol (COW)
#246

Delysium (AGI)
#247

Toshi (TOSHI)
#248

io.net (IO)
#249

Non-Playable Coin (NPC)
#250

Paal AI (PAAL)
#251

Metis (METIS)
#252

Velo (VELO)
#253

UMA (UMA)
#254
Biconomy (BICO)
#255

Illuvium (ILV)
#256

Audius (AUDIO)
#257

Sologenic (SOLO)
#258

Orbs (ORBS)
#259

OKT Chain (OKT)
#260
Icon (ICX)
#261

Aevo (AEVO)
#262

Status (SNT)
#263

Origin Ether (OETH)
#264

Clearpool (CPOOL)
#265

Across Protocol (ACX)
#266

Official Melania Meme (MELANIA)
#267

Peaq (PEAQ)
#268

Spell (SPELL)
#269

Flux (FLUX)
#270

Bounce (AUCTION)
#271

Venus (XVS)
#272

Lisk (LSK)
#273

AltLayer (ALT)
#274

Carv (CARV)
#275

Neiro (NEIRO)
#276

IOST (IOST)
#277

Decentralized Social (DESO)
#278

IQ (IQ)
#279

Iagon (IAG)
#280

Pax Dollar (USDP)
#281

Space ID (ID)
#282

Rocket Pool (RPL)
#283

Blast (BLAST)
#284

Tokenlon (LON)
#285

Radix (XRD)
#286

Manta Network (MANTA)
#287

Request (REQ)
#288

Powerledger (POWR)
#289

MVL (MVL)
#290

H2O Dao (H2O)
#291

Balancer (BAL)
#292

Memecoin (MEME)
#293

Solana Name Service (FIDA)
#294

Book Of Meme (BOME)
#295

GameBuild (GAME)
#296

Adventure Gold (AGLD)
#297

BitMart (BMX)
#298

Chromia (CHR)
#299

dKargo (DKA)
#300

Yield Guild Games (YGG)
#301

Zebec Network (ZBCN)
#302

Phala (PHA)
#303

Bone ShibaSwap (BONE)
#304

Stp (STPT)
#305

Puff The Dragon (PUFF)
#306

Ontology Gas (ONG)
#307

Songbird (SGB)
#308

WAX (WAXP)
#309

Civic (CVC)
#310

Marlin (POND)
#311

Dogelon Mars (ELON)
#312

Stratis (STRAX)
#313

Verge (XVG)
#314

Dymension (DYM)
#315

Zentry (ZENT)
#316

Dogs (DOGS)
#317

Huobi (HT)
#318

Cetus Protocol (CETUS)
#319

Pundi X (PUNDIX)
#320

ConstitutionDAO (PEOPLE)
#321

Oasys (OAS)
#322

Arcblock (ABT)
#323

Moonbeam (GLMR)
#324

Paycoin (PCI)
#325

ALEO (ALEO)
#326

Tellor Tributes (TRB)
#327

Dent (DENT)
#328

Ecomi (OMI)
#329

Centrifuge (CFG)
#330

Banana Gun (BANANA)
#331

Joe (JOE)
#332

Bit2Me (B2M)
#333

Smooth Love Potion (SLP)
#334

Medibloc (MED)
#335

Steem (STEEM)
#336

Autonolas (OLAS)
#337

Humans.ai (HEART)
#338

Taiko (TAIKO)
#339

SuperRare (RARE)
#340

Ergo (ERG)
#341

Kamino (KMNO)
#342

Comedian (BAN)
#343

Liquity (LQTY)
#344

Numeraire (NMR)
#345

Artif. Liq. Intelligence (ALI)
#346

CorgiAI (CORGIAI)
#347

Metal DAO (MTL)
#348

Degen (DEGEN)
#349

Avail (AVAIL)
#350

DODO (DODO)
#351

ChainGPT (CGPT)
#352

Secret (SCRT)
#353

ARK (ARK)
#354

Kyber Network Crystal (KNC)
#355

Nosana (NOS)
#356

NetMind Token (NMT)
#357

Xai (XAI)
#358

Goldfinch (GFI)
#359

Apu Apustaja (APU)
#360

Coin98 (C98)
#361

Wilder World (WILD)
#362

Access Protocol (ACS)
#363

Moonriver (MOVR)
#364

Vanar Chain (VANRY)
#365

WINkLink (WIN)
#366

Hydration (HDX)
#367

Celer Network (CELR)
#368

BounceBit (BB)
#369

Scroll (SCR)
#370

Aurora (AURORA)
#371

Sundog (SUNDOG)
#372

Cartesi (CTSI)
#373

Nym (NYM)
#374

Benqi (QI)
#375

Tensor (TNSR)
#376

Energy Web (EWT)
#377

Renzo (REZ)
#378

Bancor Network (BNT)
#379

Hunt (HUNT)
#380

Ponke (PONKE)
#381

Purr (PURR)
#382

Merlin Chain (MERL)
#383

ApeX (APEX)
#384

Goatseus Maximus (GOAT)
#385

Boba Network (BOBA)
#386

Shentu (CTK)
#387

SSV Network (SSV)
#388

Ocean Protocol (OCEAN)
#389

QuarkChain (QKC)
#390

Cobak (CBK)
#391

Omni Network (OMNI)
#392

Ardor (ARDR)
#393

Cyber (CYBER)
#394

Ampleforth (AMPL)
#395

Bifrost (BFC)
#396

Marinade (MNDE)
#397

Dia (DIA)
#398

Oraichain (ORAI)
#399

TrueFi (TRU)
#400

Acala (ACA)
#401

Telos (TLOS)
#402

SmarDex (SDEX)
#403

Marblex (MBX)
#404

Peapods Finance (PEAS)
#405

Keep Network (KEEP)
#406

Coq Inu (COQ)
#407

sudeng (HIPPO)
#408

Origin Token (OGN)
#409

Uquid Coin (UQC)
#410

MovieBloc (MBL)
#411

Altura (ALU)
#412

Radworks (RAD)
#413

Solidus Ai Tech (AITECH)
#414

Clover Finance (CLV)
#415

Seedify.fund (SFUND)
#416

StormX (STMX)
#417

Neutron (NTRN)
#418

Big Dog Fink (BINK)
#419

Simon's Cat (CAT)
#420

Storj (STORJ)
#421

ALEX Lab (ALEX)
#422

Dusk (DUSK)
#423

BakerySwap (BAKE)
#424

Propy (PRO)
#425

Victoria VR (VR)
#426

Synapse (SYN)
#427

Sweat Economy (SWEAT)
#428

Alephium (ALPH)
#429

Lukso (LYX)
#430

Fwog (FWOG)
#431

Kujira (KUJI)
#432

Chainflip (FLIP)
#433

RSS3 (RSS3)
#434

TokenFi (TOKEN)
#435

Gods Unchained (GODS)
#436

Automata (ATA)
#437

IX Swap (IXS)
#438

Maverick Protocol (MAV)
#439

Cortex (CTXC)
#440

Saga (SAGA)
#441

Syscoin (SYS)
#442

Hashflow (HFT)
#443

Stride (STRD)
#444

DAO Maker (DAO)
#445

Stella (ALPHA)
#446

Milady Meme Coin (LADYS)
#447

Maple (MPL)
#448

Radiant Capital (RDNT)
#449

Covalent X Token (CXT)
#450

Aergo (AERGO)
#451

ResearchCoin (RSC)
#452

Slerf (SLERF)
#453

Open Campus (EDU)
#454

Hooked Protocol (HOOK)
#455

Alien Worlds (TLM)
#456

Lumia (LUMIA)
#457

WHY (WHY)
#458

Unizen (ZCX)
#459

Hifi Finance (HIFI)
#460

ANyONe Protocol (ANYONE)
#461

NFPrompt (NFP)
#462

LimeWire (LMWR)
#463

Magic (MAGIC)
#464

Vulcan Forged (PYR)
#465

Mister Miggles (MIGGLES)
#466

Badger (BADGER)
#467

Pirate Chain (ARRR)
#468

Lista DAO (LISTA)
#469

XPLA (XPLA)
#470

Zerebro (ZEREBRO)
#471

LandWolf (WOLF)
#472

Aleph Zero (AZERO)
#473

Chill Guy (CHILLGUY)
#474

Pocket Network (POKT)
#475

Nakamoto Games (NAKA)
#476

Spectral (SPEC)
#477

NodeAI (GPU)
#478

Tars AI (TAI)
#479

Mobox (MBOX)
#480

Catizen (CATI)
#481

Myria (MYRIA)
#482

Phoenix (PHB)
#483

Agoric (BLD)
#484

NKN (NKN)
#485

REI Network (REI)
#486

Swell (SWELL)
#487

Shadow Token (SHDW)
#488

LTO Network (LTO)
#489

Karrat (KARRAT)
#490

BasedAI (BASEDAI)
#491
Pixels (PIXEL)
#492

Palm AI (PALM)
#493

Reef (REEF)
#494

Wuffi (WUF)
#495

Perpetual Protocol (PERP)
#496

Sleepless AI (AI)
#497

LeverFi (LEVER)
#498

Wojak (WOJAK)
#499

Gems VIP (GEMS)
#500

Dora Factory (DORA)
#501

Cloud (CLOUD)
#502

BOBO Coin (BOBO)
#503

Wen (WEN)
#504

ArbDoge AI (AIDOGE)
#505

Bluzelle (BLZ)
#506

Save (SLND)
#507

WazirX (WRX)
#508

PeiPei (PEIPEI)
#509

Luce (LUCE)
#510

Portal (PORTAL)
#511

RETARDIO (RETARDIO)
#512

RSK Infra. Framework (RIF)
#513

Moonwell (WELL)
#514

Carry (CRE)
#515

Fusionist (ACE)
#516

Nano (XNO)
#517

Meow (MEOW)
#518

Bitcoin Wizards (WZRD)
#519

Helium Mobile (MOBILE)
#520

Ultima (ULTIMA)
#521

NikolAI (NIKO)
#522

Mumu The Bull (MUMU)
#523

Dolos The Bully (BULLY)
#524

Function X (FX)
#525

Satoshi Airline (JET)
#526

Memes AI (MEMESAI)
#527

The Doge NFT (DOG)
#528

Velodrome Finance (VELODROME)
#529

Luckycoin (LKY)
#530

Bongo Cat (BONGO)
#531

LOCK IN (LOCKIN)
#532

Shrub (SHRUB)
#533

Mines of Dalarnia (DAR)
#534

Bertram The Pomeranian (BERT)
#535

MetaMAFIA (MAF)
#536

Bitcoin Gold (BTG)
#537

Sigma (SIGMA)
#538

Bellscoin (BELLS)
#539

Happy Cat (HAPPY)
#540

Zero1 Labs (DEAI)
#541

Dogecoin (DOGE)
#542

Entangle (NGL)
#543

Dept Of Govt Efficiency (DOGE)
#544

Fantom (FTM)
#545

First Convicted RACCON (FRED)
#546

Maneki (MANEKI)
#547

LooksRare (LOOKS)
#548

Dream Machine Token (DMT)
#549

Tectum (TET)
#550

MemeFi (MEMEFI)
#551

A3S (AA)
#552

Hoppy (HOPPY)
#553

Hasbulla's Cat (BARSIK)
#554

Arc (ARC)
#555

Tron Bull (BULL)
#556
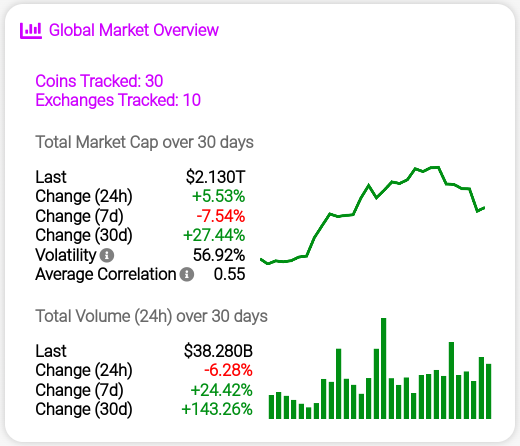
Total Market Cap: $2.440T
24h Volume: $33.050B
BTC Dominance: 67.02%
Global Market Sentiment: 37
Average Market Correlation: 0.31

Bitcoin (BTC)
#1

Ethereum (ETH)
#2

Ripple (XRP)
#3

Binance Coin (BNB)
#4

Solana (SOL)
#5

Cardano (ADA)
#6

Tron (TRX)
#7

Lido Staked Ether (STETH)
#8

Wrapped Bitcoin (WBTC)
#9

LEO Token (LEO)
#10

Tokamak Network (TON)
#11

Toncoin (TON)
#12

Chainlink (LINK)
#13

Stellar (XLM)
#14

Avalanche (AVAX)
#15

Shiba Inu (SHIB)
#16

Sui (SUI)
#17

Hedera (HBAR)
#18

Litecoin (LTC)
#19

Polkadot (DOT)
#20

Mantra (OM)
#21

Bitcoin Cash (BCH)
#22

Bitget Token (BGB)
#23

Monero (XMR)
#24

PI Network (PI)
#25

Uniswap (UNI)
#26

Dai (DAI)
#27

NEAR Protocol (NEAR)
#28

Aptos (APT)
#29

Pepe (PEPE)
#30

OKB (OKB)
#31

Gate (GT)
#32

Cronos (CRO)
#33

Ondo (ONDO)
#34

Mantle (MNT)
#35

Internet Computer (ICP)
#36

Ethereum Classic (ETC)
#37

Aave (AAVE)
#38

Cosmos (ATOM)
#39

VeChain (VET)
#40

MAGA (TRUMP)
#41

Official Trump (TRUMP)
#42

Filecoin (FIL)
#43

Bittensor (TAO)
#44

Fasttoken (FTN)
#45

Kaspa (KAS)
#46
.png)
POL (ex-MATIC) (POL)
#47

Render (RENDER)
#48

Celestia (TIA)
#49

Ethena (ENA)
#50

Algorand (ALGO)
#51

Arbitrum (ARB)
#52

KuCoin (KCS)
#53

EOS (EOS)
#54

Maker (MKR)
#55

Optimism (OP)
#56

Artif. Sup. Alliance (FET)
#57

Jupiter (JUP)
#58

NEXO (NEXO)
#59

XDC Network (XDC)
#60

Quant (QNT)
#61

Worldcoin (WLD)
#62

DeXe (DEXE)
#63

Stacks (STX)
#64

Bonk (BONK)
#65

Immutable (IMX)
#66

Flare (FLR)
#67

Injective (INJ)
#68

Sei (SEI)
#69

The Graph (GRT)
#70

Tether Gold (XAUT)
#71

Theta Network (THETA)
#72

Lido DAO (LDO)
#73

PAX Gold (PAXG)
#74

Tezos (XTZ)
#75

GALA (GALA)
#76

Curve DAO (CRV)
#77

Kaia (KAIA)
#78

Zcash (ZEC)
#79

The Sandbox (SAND)
#80

BitTorrent (BTT)
#81

Bitcoin SV (BSV)
#82

IOTA (IOTA)
#83

Jito (JTO)
#84

Flow (FLOW)
#85

PancakeSwap (CAKE)
#86

Floki (FLOKI)
#87

Grass (GRASS)
#88

Ava AI (AVA)
#89

Raydium (RAY)
#90

Helium (HNT)
#91

Pendle (PENDLE)
#92

Beldex (BDX)
#93

JasmyCoin (JASMY)
#94

dYdX (DYDX)
#95

Pyth Network (PYTH)
#96

Decentraland (MANA)
#97

Telcoin (TEL)
#98

Kava (KAVA)
#99

APENFT (NFT)
#100

Axie Infinity (AXS)
#101

Core (CORE)
#102

MultiversX (EGLD)
#103

Fartcoin (FARTCOIN)
#104

Ronin (RON)
#105

Conflux (CFX)
#106

Compound (COMP)
#107

Starknet (STRK)
#108

Chiliz (CHZ)
#109

THORChain (RUNE)
#110

Wormhole (W)
#111

eCash (XEC)
#112

Dogwifhat (WIF)
#113

Arweave (AR)
#114

ApeCoin (APE)
#115

Frax (FRAX)
#116

Beam (BEAM)
#117

Virtuals Protocol (VIRTUAL)
#118

Trust Wallet (TWT)
#119

Polygon (MATIC)
#120

LayerZero (ZRO)
#121

Axelar (AXL)
#122

NEO (NEO)
#123

Just (JST)
#124

Amp (AMP)
#125

Cheems Token (CHEEMS)
#126

Gnosis (GNO)
#127

Brett (BRETT)
#128

Aerodrome Finance (AERO)
#129

Safe (SAFE)
#130

Mina Protocol (MINA)
#131

Akash Network (AKT)
#132

MX (MX)
#133

Dash (DASH)
#134

SafePal (SFP)
#135

Creditcoin (CTC)
#136

AIOZ Network (AIOZ)
#137

1inch (1INCH)
#138

Venom (VENOM)
#139

Kusama (KSM)
#140

Cat in a dogs world (MEW)
#141

Aethir (ATH)
#142

Golem (GLM)
#143

Blur (BLUR)
#144

Theta Fuel (TFUEL)
#145

ZKsync (ZK)
#146

Snek (SNEK)
#147

Wemix (WEMIX)
#148

Zilliqa (ZIL)
#149

Synthetix Network (SNX)
#150

SuperVerse (SUPER)
#151

Notcoin (NOT)
#152

Nervos Network (CKB)
#153

Echelon Prime (PRIME)
#154

DigiByte (DGB)
#155

Astar (ASTR)
#156

Basic Attention Token (BAT)
#157

Eigenlayer (EIGEN)
#158

SwissBorg (BORG)
#159

Qtum (QTUM)
#160

0x Protocol (ZRX)
#161

Arkham (ARKM)
#162

SingularityNET (AGIX)
#163

ZetaChain (ZETA)
#164

Baby Doge Coin (BABYDOGE)
#165

Decred (DCR)
#166

Aelf (ELF)
#167

VeThor (VTHO)
#168

Stargate Finance (STG)
#169

IoTeX (IOTX)
#170

Livepeer (LPT)
#171

Osmosis (OSMO)
#172

OriginTrail (TRAC)
#173

Moca Coin (MOCA)
#174

UxLink (UXLINK)
#175

Celo (CELO)
#176

Holo (HOT)
#177

Frax Share (FXS)
#178

CHEX Token (CHEX)
#179

Ankr Network (ANKR)
#180

Convex Finance (CVX)
#181

AI Companions (AIC)
#182

Sun Token (SUN)
#183

Oasis (ROSE)
#184

yearn.finance (YFI)
#185

Ravencoin (RVN)
#186

Chia (XCH)
#187

Siacoin (SC)
#188

Hamster Kombat (HMSTR)
#189

Popcat (POPCAT)
#190

Harmony (ONE)
#191

DeepBook (DEEP)
#192

Drift Protocol (DRIFT)
#193

ORDI (ORDI)
#194

Gomining Token (GOMINING)
#195

Gigachad (GIGA)
#196

Tribe (TRIBE)
#197

Polymesh (POLYX)
#198

Peanut the Squirrel (PNUT)
#199

Mog Coin (MOG)
#200

Threshold Network (T)
#201

Polyhedra Network (ZKJ)
#202

Constellation (DAG)
#203

Metaplex (MPLX)
#204

Bitkub Coin (KUB)
#205

NEM (XEM)
#206

Hivemapper (HONEY)
#207

Gas (GAS)
#208

Enjin Coin (ENJ)
#209

Horizen (ZEN)
#210

LCX (LCX)
#211

Mythos (MYTH)
#212

WOO (WOO)
#213

GMT (GMT)
#214

Galxe (GAL)
#215

Kadena (KDA)
#216

Ontology (ONT)
#217

Loopring (LRC)
#218

XYO Network (XYO)
#219

Skale (SKL)
#220

Turbo (TURBO)
#221

Casper Network (CSPR)
#222

Zeus Network (ZEUS)
#223

Orca (ORCA)
#224

Ether.fi (ETHFI)
#225

VVS Finance (VVS)
#226

Mask Network (MASK)
#227

COTI (COTI)
#228

GMX (GMX)
#229

Qubic (QUBIC)
#230

Prom (PROM)
#231

Euler (EUL)
#232

Solar (SXP)
#233

Big Time (BIGTIME)
#234

Waves (WAVES)
#235

Sushi Swap (SUSHI)
#236

Alchemy Pay (ACH)
#237

Band Protocol (BAND)
#238
.png)
SATS (Ordinals) (SATS)
#239

Gravity (G)
#240

Zignaly (ZIG)
#241

Syrup (SYRUP)
#242

API3 (API3)
#243

Bora (BORA)
#244

Hive (HIVE)
#245

CoW Protocol (COW)
#246

Delysium (AGI)
#247

Toshi (TOSHI)
#248

io.net (IO)
#249

Non-Playable Coin (NPC)
#250

Paal AI (PAAL)
#251

Metis (METIS)
#252

Velo (VELO)
#253

UMA (UMA)
#254
Biconomy (BICO)
#255

Illuvium (ILV)
#256

Audius (AUDIO)
#257

Sologenic (SOLO)
#258

Orbs (ORBS)
#259

OKT Chain (OKT)
#260
Icon (ICX)
#261

Aevo (AEVO)
#262

Status (SNT)
#263

Origin Ether (OETH)
#264

Clearpool (CPOOL)
#265

Across Protocol (ACX)
#266

Official Melania Meme (MELANIA)
#267

Peaq (PEAQ)
#268

Spell (SPELL)
#269

Flux (FLUX)
#270

Bounce (AUCTION)
#271

Venus (XVS)
#272

Lisk (LSK)
#273

AltLayer (ALT)
#274

Carv (CARV)
#275

Neiro (NEIRO)
#276

IOST (IOST)
#277

Decentralized Social (DESO)
#278

IQ (IQ)
#279

Iagon (IAG)
#280

Pax Dollar (USDP)
#281

Space ID (ID)
#282

Rocket Pool (RPL)
#283

Blast (BLAST)
#284

Tokenlon (LON)
#285

Radix (XRD)
#286

Manta Network (MANTA)
#287

Request (REQ)
#288

Powerledger (POWR)
#289

MVL (MVL)
#290

H2O Dao (H2O)
#291

Balancer (BAL)
#292

Memecoin (MEME)
#293

Solana Name Service (FIDA)
#294

Book Of Meme (BOME)
#295

GameBuild (GAME)
#296

Adventure Gold (AGLD)
#297

BitMart (BMX)
#298

Chromia (CHR)
#299

dKargo (DKA)
#300

Yield Guild Games (YGG)
#301

Zebec Network (ZBCN)
#302

Phala (PHA)
#303

Bone ShibaSwap (BONE)
#304

Stp (STPT)
#305

Puff The Dragon (PUFF)
#306

Ontology Gas (ONG)
#307

Songbird (SGB)
#308

WAX (WAXP)
#309

Civic (CVC)
#310

Marlin (POND)
#311

Dogelon Mars (ELON)
#312

Stratis (STRAX)
#313

Verge (XVG)
#314

Dymension (DYM)
#315

Zentry (ZENT)
#316

Dogs (DOGS)
#317

Huobi (HT)
#318

Cetus Protocol (CETUS)
#319

Pundi X (PUNDIX)
#320

ConstitutionDAO (PEOPLE)
#321

Oasys (OAS)
#322

Arcblock (ABT)
#323

Moonbeam (GLMR)
#324

Paycoin (PCI)
#325

ALEO (ALEO)
#326

Tellor Tributes (TRB)
#327

Dent (DENT)
#328

Ecomi (OMI)
#329

Centrifuge (CFG)
#330

Banana Gun (BANANA)
#331

Joe (JOE)
#332

Bit2Me (B2M)
#333

Smooth Love Potion (SLP)
#334

Medibloc (MED)
#335

Steem (STEEM)
#336

Autonolas (OLAS)
#337

Humans.ai (HEART)
#338

Taiko (TAIKO)
#339

SuperRare (RARE)
#340

Ergo (ERG)
#341

Kamino (KMNO)
#342

Comedian (BAN)
#343

Liquity (LQTY)
#344

Numeraire (NMR)
#345

Artif. Liq. Intelligence (ALI)
#346

CorgiAI (CORGIAI)
#347

Metal DAO (MTL)
#348

Degen (DEGEN)
#349

Avail (AVAIL)
#350

DODO (DODO)
#351

ChainGPT (CGPT)
#352

Secret (SCRT)
#353

ARK (ARK)
#354

Kyber Network Crystal (KNC)
#355

Nosana (NOS)
#356

NetMind Token (NMT)
#357

Xai (XAI)
#358

Goldfinch (GFI)
#359

Apu Apustaja (APU)
#360

Coin98 (C98)
#361

Wilder World (WILD)
#362

Access Protocol (ACS)
#363

Moonriver (MOVR)
#364

Vanar Chain (VANRY)
#365

WINkLink (WIN)
#366

Hydration (HDX)
#367

Celer Network (CELR)
#368

BounceBit (BB)
#369

Scroll (SCR)
#370

Aurora (AURORA)
#371

Sundog (SUNDOG)
#372

Cartesi (CTSI)
#373

Nym (NYM)
#374

Benqi (QI)
#375

Tensor (TNSR)
#376

Energy Web (EWT)
#377

Renzo (REZ)
#378

Bancor Network (BNT)
#379

Hunt (HUNT)
#380

Ponke (PONKE)
#381

Purr (PURR)
#382

Merlin Chain (MERL)
#383

ApeX (APEX)
#384

Goatseus Maximus (GOAT)
#385

Boba Network (BOBA)
#386

Shentu (CTK)
#387

SSV Network (SSV)
#388

Ocean Protocol (OCEAN)
#389

QuarkChain (QKC)
#390

Cobak (CBK)
#391

Omni Network (OMNI)
#392

Ardor (ARDR)
#393

Cyber (CYBER)
#394

Ampleforth (AMPL)
#395

Bifrost (BFC)
#396

Marinade (MNDE)
#397

Dia (DIA)
#398

Oraichain (ORAI)
#399

TrueFi (TRU)
#400

Acala (ACA)
#401

Telos (TLOS)
#402

SmarDex (SDEX)
#403

Marblex (MBX)
#404

Peapods Finance (PEAS)
#405

Keep Network (KEEP)
#406

Coq Inu (COQ)
#407

sudeng (HIPPO)
#408

Origin Token (OGN)
#409

Uquid Coin (UQC)
#410

MovieBloc (MBL)
#411

Altura (ALU)
#412

Radworks (RAD)
#413

Solidus Ai Tech (AITECH)
#414

Clover Finance (CLV)
#415

Seedify.fund (SFUND)
#416

StormX (STMX)
#417

Neutron (NTRN)
#418

Big Dog Fink (BINK)
#419

Simon's Cat (CAT)
#420

Storj (STORJ)
#421

ALEX Lab (ALEX)
#422

Dusk (DUSK)
#423

BakerySwap (BAKE)
#424

Propy (PRO)
#425

Victoria VR (VR)
#426

Synapse (SYN)
#427

Sweat Economy (SWEAT)
#428

Alephium (ALPH)
#429

Lukso (LYX)
#430

Fwog (FWOG)
#431

Kujira (KUJI)
#432

Chainflip (FLIP)
#433

RSS3 (RSS3)
#434

TokenFi (TOKEN)
#435

Gods Unchained (GODS)
#436

Automata (ATA)
#437

IX Swap (IXS)
#438

Maverick Protocol (MAV)
#439

Cortex (CTXC)
#440

Saga (SAGA)
#441

Syscoin (SYS)
#442

Hashflow (HFT)
#443

Stride (STRD)
#444

DAO Maker (DAO)
#445

Stella (ALPHA)
#446

Milady Meme Coin (LADYS)
#447

Maple (MPL)
#448

Radiant Capital (RDNT)
#449

Covalent X Token (CXT)
#450

Aergo (AERGO)
#451

ResearchCoin (RSC)
#452

Slerf (SLERF)
#453

Open Campus (EDU)
#454

Hooked Protocol (HOOK)
#455

Alien Worlds (TLM)
#456

Lumia (LUMIA)
#457

WHY (WHY)
#458

Unizen (ZCX)
#459

Hifi Finance (HIFI)
#460

ANyONe Protocol (ANYONE)
#461

NFPrompt (NFP)
#462

LimeWire (LMWR)
#463

Magic (MAGIC)
#464

Vulcan Forged (PYR)
#465

Mister Miggles (MIGGLES)
#466

Badger (BADGER)
#467

Pirate Chain (ARRR)
#468

Lista DAO (LISTA)
#469

XPLA (XPLA)
#470

Zerebro (ZEREBRO)
#471

LandWolf (WOLF)
#472

Aleph Zero (AZERO)
#473

Chill Guy (CHILLGUY)
#474

Pocket Network (POKT)
#475

Nakamoto Games (NAKA)
#476

Spectral (SPEC)
#477

NodeAI (GPU)
#478

Tars AI (TAI)
#479

Mobox (MBOX)
#480

Catizen (CATI)
#481

Myria (MYRIA)
#482

Phoenix (PHB)
#483

Agoric (BLD)
#484

NKN (NKN)
#485

REI Network (REI)
#486

Swell (SWELL)
#487

Shadow Token (SHDW)
#488

LTO Network (LTO)
#489

Karrat (KARRAT)
#490

BasedAI (BASEDAI)
#491
Pixels (PIXEL)
#492

Palm AI (PALM)
#493

Reef (REEF)
#494

Wuffi (WUF)
#495

Perpetual Protocol (PERP)
#496

Sleepless AI (AI)
#497

LeverFi (LEVER)
#498

Wojak (WOJAK)
#499

Gems VIP (GEMS)
#500

Dora Factory (DORA)
#501

Cloud (CLOUD)
#502

BOBO Coin (BOBO)
#503

Wen (WEN)
#504

ArbDoge AI (AIDOGE)
#505

Bluzelle (BLZ)
#506

Save (SLND)
#507

WazirX (WRX)
#508

PeiPei (PEIPEI)
#509

Luce (LUCE)
#510

Portal (PORTAL)
#511

RETARDIO (RETARDIO)
#512

RSK Infra. Framework (RIF)
#513

Moonwell (WELL)
#514

Carry (CRE)
#515

Fusionist (ACE)
#516

Nano (XNO)
#517

Meow (MEOW)
#518

Bitcoin Wizards (WZRD)
#519

Helium Mobile (MOBILE)
#520

Ultima (ULTIMA)
#521

NikolAI (NIKO)
#522

Mumu The Bull (MUMU)
#523

Dolos The Bully (BULLY)
#524

Function X (FX)
#525

Satoshi Airline (JET)
#526

Memes AI (MEMESAI)
#527

The Doge NFT (DOG)
#528

Velodrome Finance (VELODROME)
#529

Luckycoin (LKY)
#530

Bongo Cat (BONGO)
#531

LOCK IN (LOCKIN)
#532

Shrub (SHRUB)
#533

Mines of Dalarnia (DAR)
#534

Bertram The Pomeranian (BERT)
#535

MetaMAFIA (MAF)
#536

Bitcoin Gold (BTG)
#537

Sigma (SIGMA)
#538

Bellscoin (BELLS)
#539

Happy Cat (HAPPY)
#540

Zero1 Labs (DEAI)
#541

Dogecoin (DOGE)
#542

Entangle (NGL)
#543

Dept Of Govt Efficiency (DOGE)
#544

Fantom (FTM)
#545

First Convicted RACCON (FRED)
#546

Maneki (MANEKI)
#547

LooksRare (LOOKS)
#548

Dream Machine Token (DMT)
#549

Tectum (TET)
#550

MemeFi (MEMEFI)
#551

A3S (AA)
#552

Hoppy (HOPPY)
#553

Hasbulla's Cat (BARSIK)
#554

Arc (ARC)
#555

Tron Bull (BULL)
#556
Information related to market and risk metrics methodologies

Total Market Cap=∑(Price of each cryptocurrency * Circulating supply of each cryptocurrency)
In simpler terms, it adds up the market capitalization of every individual cryptocurrency. Market capitalization for each cryptocurrency is calculated by multiplying the current price of the cryptocurrency by its circulating supply (the number of cryptos currently in circulation).The Relative Strength Index (RSI) is calculated using the following formula:
RSI = 100 - ( 100 / ( 1 + RS ) )
Where RS is calculated as:
RS = EWMA Gains of Total Market Cap over the last 14 days / EWMA Losses of Total Market Capover the last 14 periods
Where EWMA is the Exponentially Weighted Moving Average of Gains (Losses) of Total Market Cap with the parameter Alpha
EWMA being computed over the last 14 periods, we set the parameter Alpha = 2 / (1 + N), where N = 14 periods
Note that for the displayed Global Relative Strength Index in the Global Overview, the EWMA is computed over the last 14 days.
The Average Correlation across all cryptos measures how similarly the prices of different cryptocurrencies move in relation to each other. It is calculated by averaging the pairwise correlations between the price movements of all tracked cryptos pairs in the market.
A high Average Correlation indicates that most cryptos tend to move in the same direction, either up or down, while a low Average Correlation suggests more independent price movements among cryptos.
This metric helps assess the overall interconnectedness of the crypto market.
The Average Correlation is calculated as the average of all correlations between all cryptos' Hourly Returns over 30 days

The Price of each crypto is calculated as the Volume-Weighted Average across all tracked exchanges, considering only crypto/stablecoin (or crypto/fiat USD) trading pairs.
The 24h Volume is determined by summing the trading volumes across all tracked exchanges, again using only crypto/stablecoin (or crypto/fiat USD) pairs for the calculation.
For a crypto, the Circulating Supply refers to the total number of coins that are currently available and actively circulating in the market. It excludes coins that are locked, reserved, or otherwise unavailable to the public. Circulating supply is necessary for calculating the market capitalization

The Volatility of a crypto refers to the degree of variation in its price over a specific period of time. It reflects how much and how quickly the price of the crypto fluctuates. High volatility means the price experiences large, frequent swings, while low volatility indicates more stable price movement.
It is computed as the Annualized Historical Volatility of the Daily Returns over the last 30 days.
BTC and ETH Correlations measure how a crypto is correlated respectively with BTC (Bitcoin) and ETH (Ethereum) over the last 30 days to understand how the crypto price moves in relation to BTC and ETH.
For example, a high positive BTC correlation means the crypto tends to move in the same direction as BTC, while a negative correlation indicates they move in opposite directions. A correlation close to zero suggests no strong relationship between their price movements. This helps to assess how much the crypto’s performance depends on Bitcoin's and Ethereum's market behavior.
The Market Correlation measure how a crypto is correlated with the total crypto market to see how its price moves relative to the overall market value.
A strong positive correlation means the crypto tends to rise and fall with the total market, while a negative correlation suggests it moves in the opposite direction. A near-zero correlation indicates little to no relationship with the broader market's movements. This helps assess the crypto’s sensitivity to overall market trends and conditions.
The Beta coefficient measures the sensitivity of a crypto's price in relation to the overall market.
A Beta greater than 1 means the crypto is more volatile than the market, moving more dramatically in response to market changes. A Beta less than 1 indicates it is less volatile, with smaller price movements compared to the market. A Beta of 1 means the crypto moves in line with the market. It's a key indicator of risk relative to the overall market.
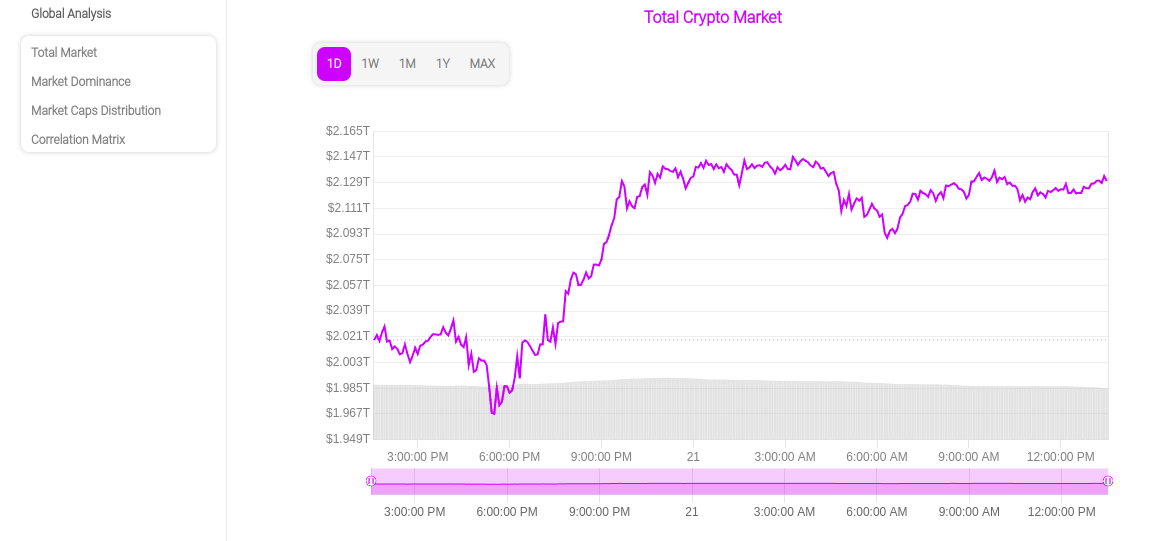
The Total Crypto Market chart displays the combined market capitalization and exchanged volumes (only pairs crypto/stablecoin (and crypto/fiat USD) are taken into account) of all crypto over time. It visually represents the overall value of the crypto market, highlighting trends, growth, and fluctuations in the total market size. This chart helps provide a big-picture view of the crypto market's performance and is useful for tracking its long-term health and dynamics.
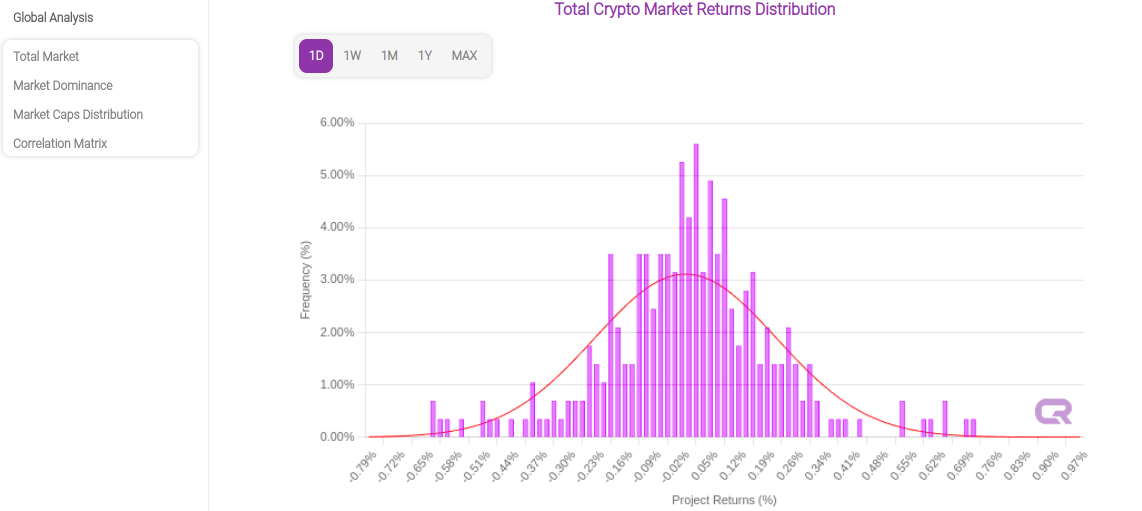
The Total Crypto Market Returns Distribution chart shows the frequency and range of the overall crypto market returns over a specific period. It helps visualize how often certain market return levels occur, indicating the market's performance patterns, volatility, and potential risk. This chart is useful for understanding the likelihood of gains or losses and assessing the overall market return profile.
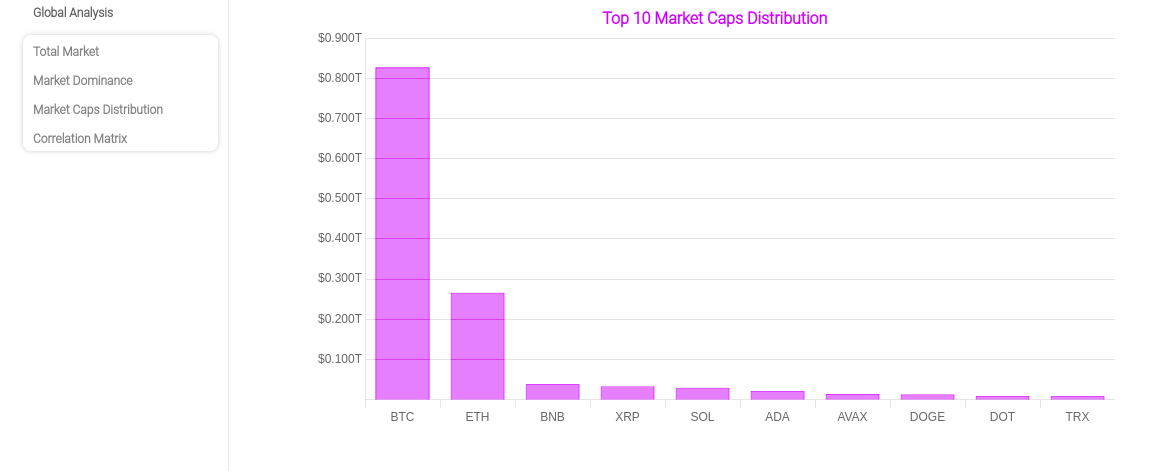
The Top 10 Market Caps Distribution chart presents the relative size of the top 10 cryptos by market capitalization. It illustrates how the market value is distributed among these leading assets, providing insight into their individual market weight and comparing their sizes within the top tier of cryptos.
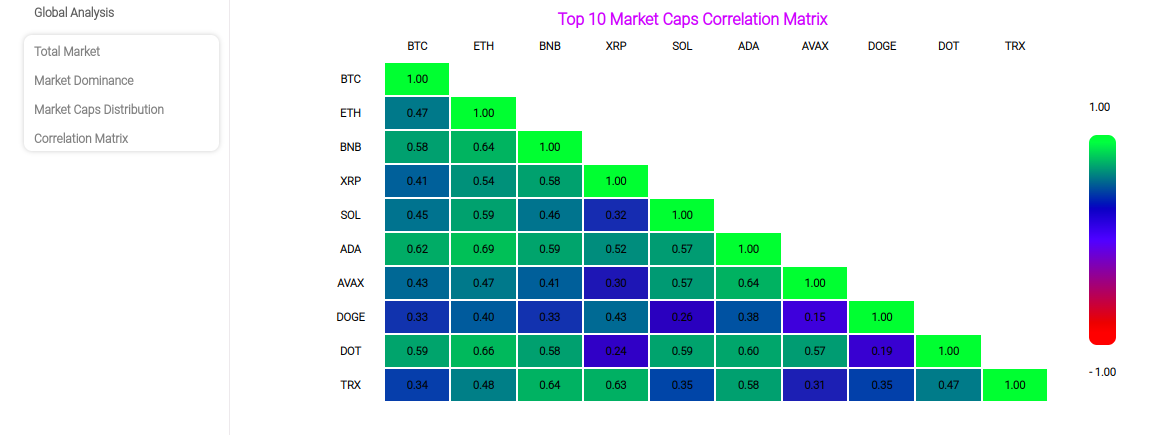
The Top 10 Market Caps Correlation Matrix visually represents the relationships between the top 10 cryptos by market capitalization, showing how their price movements are correlated. A positive correlation indicates that the assets tend to move in the same direction, while a negative correlation shows they move in opposite directions. This matrix helps assess the interconnectedness of leading cryptos in the market.
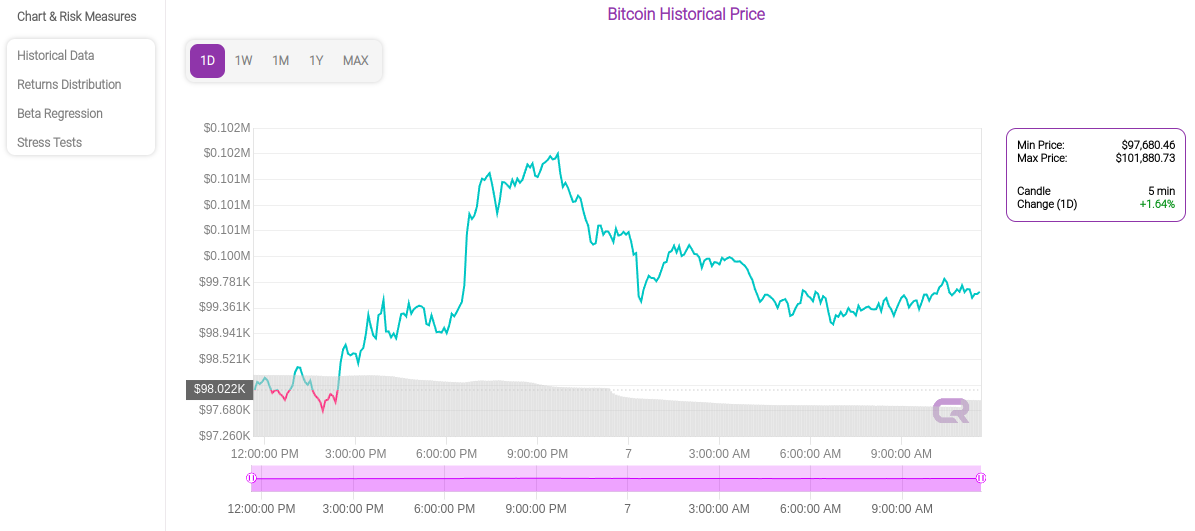
The Historical Price and Volume chart displays a crypto’s price performance over various timeframes, integrated with volume bars to highlight trading activity. This combined view helps users assess market trends, price volatility, and the correlation between price movements and trading volumes for deeper insights.
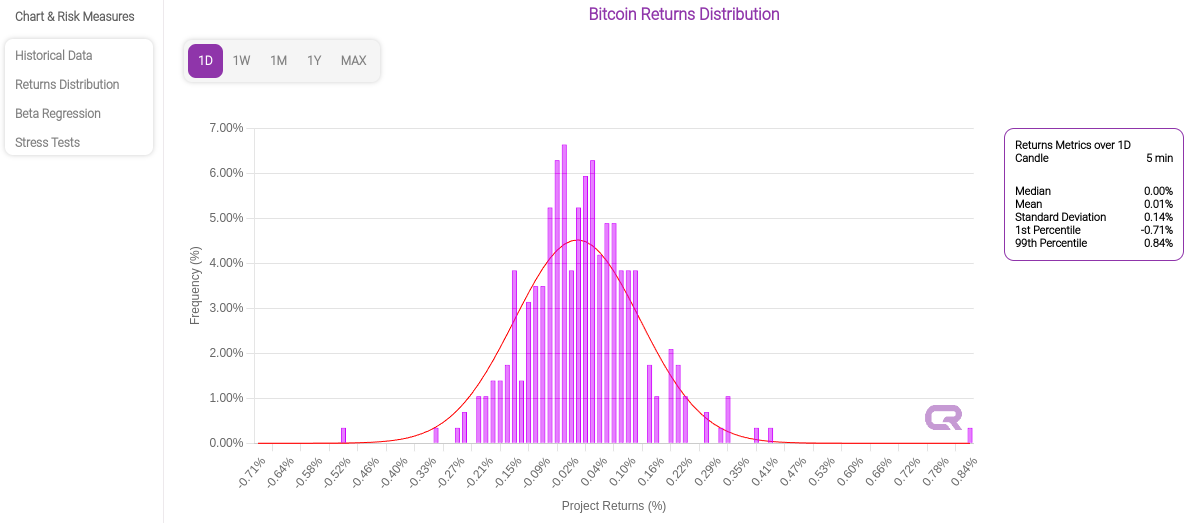
The Returns Distribution chart shows the frequency and range of a crypto's returns over a specific period. It helps visualize how often certain return levels occur, indicating the asset's performance patterns, volatility, and potential risk. This chart is useful for understanding the likelihood of gains or losses and assessing the asset's overall return profile.
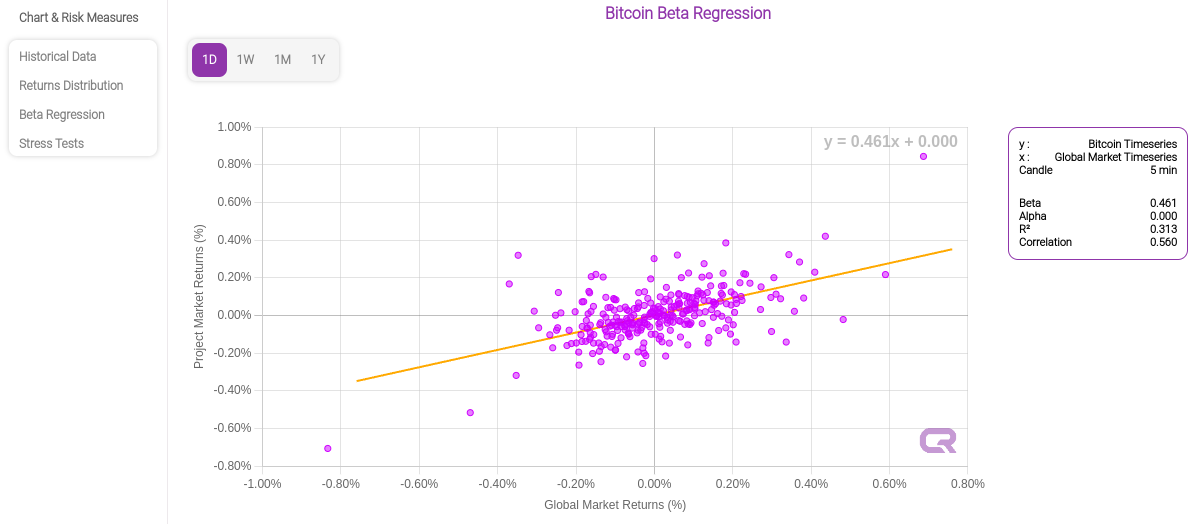
The Beta Regression chart displays the sensitivity of a crypto's price movement compared to the overall market. It shows how much the crypto tends to rise or fall in response to market changes, with a higher beta indicating greater volatility relative to the market. This chart helps assess the asset's risk and its correlation with broader market trends.
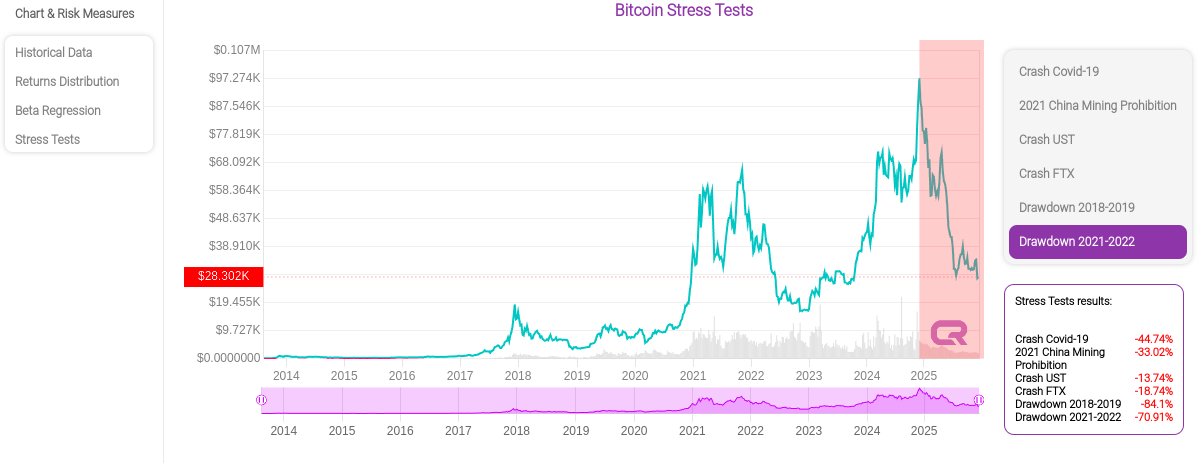
The Stress Tests chart evaluates how a crypto performs under extreme market conditions. It simulates adverse scenarios to measure the potential impact on the asset's price and volatility. This chart helps assess the resilience of the crypto during periods of market stress and uncertainty, providing insights into its risk under challenging conditions.
Each Stress Test scenario is determined by a simple and intuitive methodology:
Step 1: Define the Weekly Returns timeseries of the Total Crypto Market Cap for each sceanrio:
Step 2: For a crypto, starting from its last Weekly price, apply the Weekly Returns timeseries of the chosen sceanrio iteratively, adjusting by the Beta coefficient at each step (Beta coefficient computed over last year).
Step 3: Display the results:
In the chart above, in the red area, we can see as a projection the effect of a market crash similar to the Drawdown 2021-2022 on the Bitcoin price. Such a projection can be useful as a visual reminder when you forget, because of the FOMO, what could occurr on the market and how it could crash violently.
In the box "Stress Tests reuslts", we can see the percentage of decrease for each scenario.
Total Market Cap=∑(Price of each cryptocurrency * Circulating supply of each cryptocurrency)
In simpler terms, it adds up the market capitalization of every individual cryptocurrency. Market capitalization for each cryptocurrency is calculated by multiplying the current price of the cryptocurrency by its circulating supply (the number of coins or tokens currently in circulation).The Relative Strength Index (RSI) is calculated using the following formula:
RSI = 100 - ( 100 / ( 1 + RS ) )
Where RS is calculated as:
RS = EWMA Gains of Total Market Cap over the last 14 days / EWMA Losses of Total Market Capover the last 14 periods
Where EWMA is the Exponentially Weighted Moving Average of Gains (Losses) of Total Market Cap with the parameter Alpha
EWMA being computed over the last 14 periods, we set the parameter Alpha = 2 / (1 + N), where N = 14 periods
Note that for the displayed Global Relative Strength Index in the Global Overview, the EWMA is computed over the last 14 days.
The Average Correlation across all cryptos measures how similarly the prices of different cryptocurrencies move in relation to each other. It is calculated by averaging the pairwise correlations between the price movements of all tracked cryptos pairs in the market.
A high Average Correlation indicates that most cryptos tend to move in the same direction, either up or down, while a low Average Correlation suggests more independent price movements among cryptos.
This metric helps assess the overall interconnectedness of the crypto market.
The Average Correlation is calculated as the average of all correlations between all cryptos' Hourly Returns over 30 days

The Price of each crypto is calculated as the Volume-Weighted Average across all tracked exchanges, considering only crypto/stablecoin (or crypto/fiat USD) trading pairs.
The 24h Volume is determined by summing the trading volumes across all tracked exchanges, again using only crypto/stablecoin (or crypto/fiat USD) pairs for the calculation.
For a crypto, the Circulating Supply refers to the total number of coins that are currently available and actively circulating in the market. It excludes coins that are locked, reserved, or otherwise unavailable to the public. Circulating supply is necessary for calculating the market capitalization

The Volatility of a crypto refers to the degree of variation in its price over a specific period of time. It reflects how much and how quickly the price of the crypto fluctuates. High volatility means the price experiences large, frequent swings, while low volatility indicates more stable price movement.
It is computed as the Annualized Historical Volatility of the Daily Returns over the last 30 days.
BTC and ETH Correlations measure how a crypto is correlated respectively with BTC (Bitcoin) and ETH (Ethereum) over the last 30 days to understand how the crypto price moves in relation to BTC and ETH.
For example, a high positive BTC correlation means the crypto tends to move in the same direction as BTC, while a negative correlation indicates they move in opposite directions. A correlation close to zero suggests no strong relationship between their price movements. This helps to assess how much the crypto’s performance depends on Bitcoin's and Ethereum's market behavior.
The Market Correlation measure how a crypto is correlated with the total crypto market to see how its price moves relative to the overall market value.
A strong positive correlation means the crypto tends to rise and fall with the total market, while a negative correlation suggests it moves in the opposite direction. A near-zero correlation indicates little to no relationship with the broader market's movements. This helps assess the crypto’s sensitivity to overall market trends and conditions.
The Beta coefficient measures the sensitivity of a crypto's price in relation to the overall market.
A Beta greater than 1 means the crypto is more volatile than the market, moving more dramatically in response to market changes. A Beta less than 1 indicates it is less volatile, with smaller price movements compared to the market. A Beta of 1 means the crypto moves in line with the market. It's a key indicator of risk relative to the overall market.
 Total Market Capitalization (Total Market Cap) in cryptocurrency refers to the total value of all tracked cryptocurrencies combined.
To calculate the Total Market Cap, the following formula is used:
Total Market Capitalization (Total Market Cap) in cryptocurrency refers to the total value of all tracked cryptocurrencies combined.
To calculate the Total Market Cap, the following formula is used:Total Market Cap=∑(Price of each cryptocurrency * Circulating supply of each cryptocurrency)
In simpler terms, it adds up the market capitalization of every individual cryptocurrency. Market capitalization for each cryptocurrency is calculated by multiplying the current price of the cryptocurrency by its circulating supply (the number of coins or tokens currently in circulation).
The Total Crypto Market Returns Distribution chart shows the frequency and range of the overall crypto market returns over a specific period. It helps visualize how often certain market return levels occur, indicating the market's performance patterns, volatility, and potential risk. This chart is useful for understanding the likelihood of gains or losses and assessing the overall market return profile.

The Top 10 Market Caps Distribution chart presents the relative size of the top 10 cryptos by market capitalization. It illustrates how the market value is distributed among these leading assets, providing insight into their individual market weight and comparing their sizes within the top tier of cryptos.

The Top 10 Market Caps Correlation Matrix visually represents the relationships between the top 10 cryptos by market capitalization, showing how their price movements are correlated. A positive correlation indicates that the assets tend to move in the same direction, while a negative correlation shows they move in opposite directions. This matrix helps assess the interconnectedness of leading cryptos in the market.

The Historical Price and Volume chart displays a crypto’s price performance over various timeframes, integrated with volume bars to highlight trading activity. This combined view helps users assess market trends, price volatility, and the correlation between price movements and trading volumes for deeper insights.

The Returns Distribution chart shows the frequency and range of a crypto's returns over a specific period. It helps visualize how often certain return levels occur, indicating the asset's performance patterns, volatility, and potential risk. This chart is useful for understanding the likelihood of gains or losses and assessing the asset's overall return profile.

The Beta Regression chart displays the sensitivity of a crypto's price movement compared to the overall market. It shows how much the crypto tends to rise or fall in response to market changes, with a higher beta indicating greater volatility relative to the market. This chart helps assess the asset's risk and its correlation with broader market trends.

The Stress Tests chart evaluates how a crypto performs under extreme market conditions. It simulates adverse scenarios to measure the potential impact on the asset's price and volatility. This chart helps assess the resilience of the crypto during periods of market stress and uncertainty, providing insights into its risk under challenging conditions.
Each Stress Test scenario is determined by a simple and intuitive methodology:
Step 1: Define the Weekly Returns timeseries of the Total Crypto Market Cap for each sceanrio:
Step 2: For a crypto, starting from its last Weekly price, apply the Weekly Returns timeseries of the chosen sceanrio iteratively, adjusting by the Beta coefficient at each step (Beta coefficient computed over last year).
Step 3: Display the results:
In the chart above, in the red area, we can see as a projection the effect of a market crash similar to the Drawdown 2021-2022 on the Bitcoin price. Such a projection can be useful as a visual reminder when you forget, because of the FOMO, what could occurr on the market and how it could crash violently.
In the box "Stress Tests reuslts", we can see the percentage of decrease for each scenario.
